
Identifying Monthly Breakout Stocks Using Indicators in 2025
Identifying breakout stocks can be a powerful strategy for traders looking to capitalize on significant price movements. Using technical indicators such as moving averages, RSI, and volume analysis will help identify these opportunities quickly in 2025.
Breakouts often signal that a stock is ready to break past resistance levels, leading to potential gains. This approach, when combined with proper chart analysis, offers a structured way to identify high-potential stocks.
In this article, you will learn how to properly utilize these tools in order to discover breakout stocks in 2025.
Understanding Stock Breakouts
A stock breakout happens when the price of a stock is able to cross a certain resistance or support that had previously been established. This indicates a potential shift in market sentiment.
In the share market, Support levels represent price points where a stock tends to find buying interest, preventing further decline. Resistance levels are price points where selling pressure typically emerges, capping price increases.
When a stock’s price decisively moves above resistance or below support, it often signals the start of a new trend, either upward or downward.
Key Technical Indicators for Identifying Breakouts
To identify monthly breakout stocks, it is important to check some technical indicators that may signal a price increase. Below are some of the indicators one should assess:
1. Moving Averages
Moving averages help smooth out price fluctuations to reveal a stock’s overall trend. Traders often use two types: short-term and long-term averages.
When a short-term moving average crosses above a long-term one, it suggests the stock may be entering an uptrend, signaling a potential breakout. The 50-day and 200-day moving averages are generally used for this strategy.
This crossover helps identify a stock gaining momentum, increasing the likelihood of a sustained price rise.
2. Relative Strength Index (RSI)
RSI helps to determine the level at which the stock is overbought or oversold. On the scale between 0 and 100, a reading above 70 indicates “overbought” and below 30 means “oversold.”
If there’s a bullish divergence, the price decreases and the relative strength index (RSI) increases, which can indicate that a potential price breakout could occur.
For example, if a stock drops to a new low but the RSI increases, it could indicate the start of an upward breakout as momentum shifts.
3. Volume Analysis
Volume refers to the number of shares or contracts traded in a stock or market during a specific time. High volume during a breakout suggests strong investor interest, increasing the likelihood of the price continuing in the breakout direction.
When a stock breaks through resistance or support levels, a surge in volume helps confirm the move, making it more reliable.
Low volume, on the other hand, may indicate a false breakout, where the price could reverse.
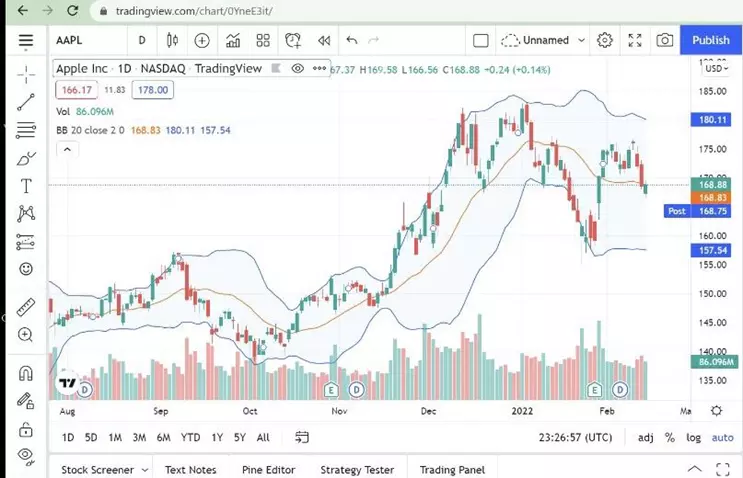
4. Bollinger Bands
Bollinger Bands consist of three lines: a middle line (usually a moving average) and two outer bands that represent standard deviations from the middle line.
These bands expand or contract based on market volatility. When the price moves above the upper band, it may signal that the stock is overbought, while a drop below the lower band could indicate an oversold condition.
Breakouts often happen when the price moves outside these bands, suggesting potential price shifts.
5. Moving Average Convergence Divergence (MACD)
MACD is a popular indicator that shows the relationship between two moving averages of a stock’s price. It consists of a MACD line and a signal line.
When the MACD line crosses above the signal line, it suggests upward momentum, often indicating a potential breakout. On the other hand, when the MACD line crosses below the signal line, it signals a possible downward trend.
Traders use MACD to identify trend changes and confirm breakout opportunities.
Conclusion
Identifying monthly breakout in stocks using technical indicators can improve your investment strategy in 2025. Combining tools like moving averages, RSI, and volume analysis helps spot opportunities early. When used correctly, this method increases the chances of successful trades. Remember, practice and careful risk management are key to making the most of these breakout signals.

Is Reaper Scans Free?

